It’s time for a new Stratospheric eBook release 🥳
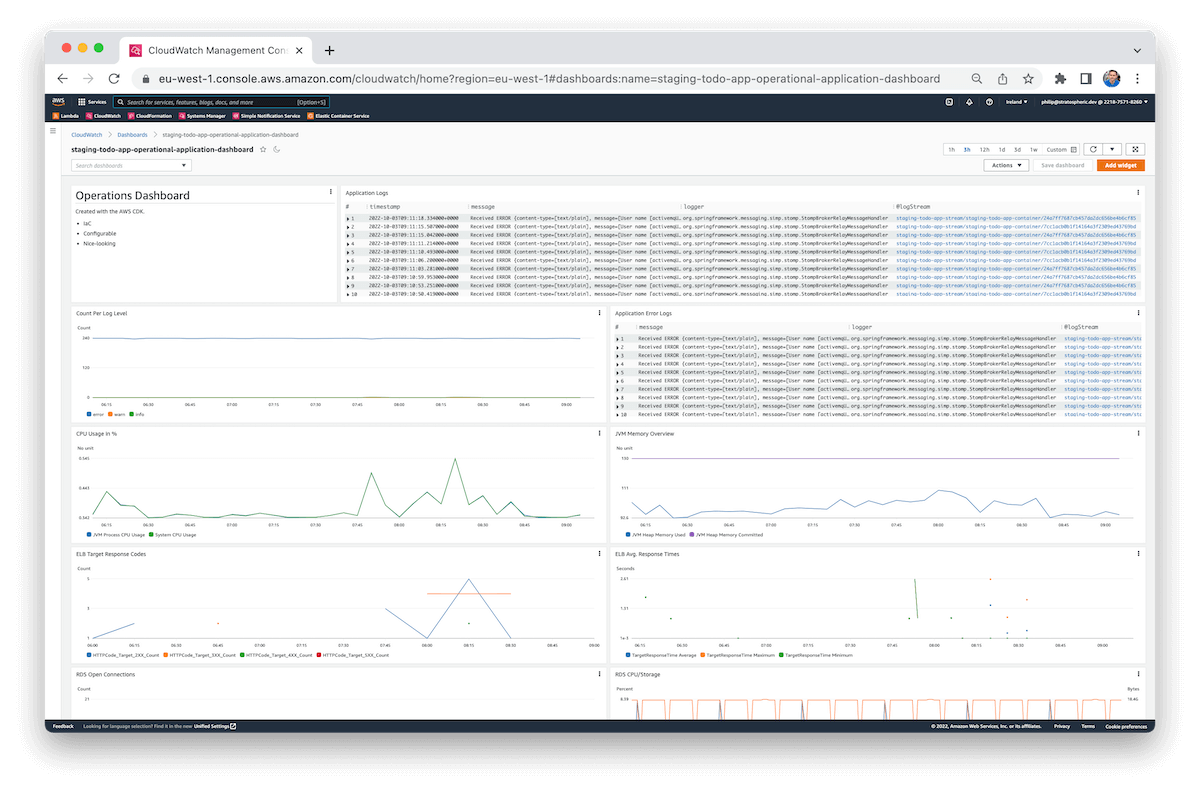
With our current Stratospheric online course recording efforts, we added a ready-to-use blueprint for an operational Amazon CloudWatch dashboard for our Spring Boot application:

While we explain the basic building blocks on how to create an Amazon CloudWatch dashboard with the AWS CDK, so far, we’ve never had a ready-to-use dashboard with key metrics for the Todo application.
The OperationalCloudWatchDasbord fills this gap and visualizes the following information:
- the recent info and error logs from our Spring Boot application
- the distribution (count) of the different log levels
- CPU utilization and JVM memory consumption of the Spring Boot application
- important ELB metrics: the distribution of returned status codes and the average response times
- key RDS metrics for the CPU usage, storage, and open JDBC connections
- metrics for the SQS queue and its dead-letter queue to identify failed or slow message consumptions
This dashboard is created with the AWS CDK and can be used as a source of inspiration for your first Amazon CloudWatch dashboard.
Furthermore, we fixed some inconsistencies in our manuscript. Thanks to Alan (amoffet) for reporting them.
With our goal to keep the content relevant and up-to-date, we sometimes fail to keep the manuscript in sync or miss sections to adjust. Feel free to report any inconsistencies as soon as you find them.
Finally, as our complementary online course is making good progress, we now refer to it as part of the introduction and outro.
If you’ve already purchased the eBook, you can now download the latest version at no extra charge in your Leanpub Book Library.
For further questions, feedback, or errata, either drop us a message (info@stratospheric.dev) or open an issue at the GitHub repository.
PS: We plan to upload the next set of videos for the Stratospheric online course at the beginning of November.
